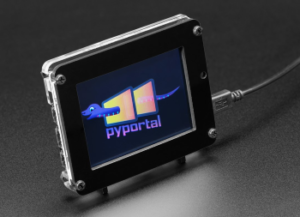
 Adafruit’s Pyportal is a pretty powerful little device. One of it’s main functions are to grab and display data from internet APIs, but it can also easily log data to the cloud using Adafruit IO, has a couple built in sensors, and can be used to play games and perform other functions. Per Adafruit’s overview page, “the PyPortal uses an ATMEL (Microchip) ATSAMD51J20, and an Espressif ESP32 Wi-Fi coprocessor with TLS/SSL (secure web) support built-in. PyPortal has a 3.2″ 320 x 240 color TFT with resistive touch screen. PyPortal includes: speaker, light sensor, temperature sensor, NeoPixel, microSD card slot, 8MB flash, plug-in ports for I2C, and 2 analog/digital pins.”
It’s called the Pyportal because it provides a portal (window) to information on the Internet and it’s programmed in CircuitPython, which is Adafruit’s fork of MicroPython and is an implementation of the Python programming language for microcontrollers.
There are a lot of examples of single-function applications available, such as weather, air quality, event count-down clock, and even how many astronauts are currently in space, along with their names. What I wanted to do was to have the device cycle through multiple applications. I ended up coding it to provide
- The day, date, and time (inspired by how cruise ship’s change out a piece of carpet every day in the elevators to tell you what day of the week it is),
- The current local weather,
- The latest “shower thought” post from the shower thoughts subreddit, and
- The current value and change from the previoius day for the S&P 500.
The project ended up to not be quite as easy as I thought it would be, but still pretty easy. I ended up restructuring a lot of the examples code to work better with scrolling through multiple functions, but the final result still borrows heavily from the examples previously posted online.
In this post, I won’t repeat the basics for getting up and running, which can be found online, but I will do a brief walkthrough of my code, which is posted on gitHub. To use it yourself, you’ll need to edit the “secrets.py” file to provide your WIFI login information as well as sign up with the API providers and put your personal keys or ID in that file. You will also want to provide the location id for your location for the local weather, rather than mine, in the main program.
Overview (code module)
The program consists of a main module that first takes care of initial setup, making the wifi connection, and initializing variables, for example, the location ID for the local weather and the URLs for the various data sources. Then it launches an infinite loop to go through and access and display the various types of data. In each case, there is a timer so that the URLs are not constantly being visited each loop.
For the weather and S&P 500 applications and initial background screen is loaded and briefly displayed. This changes to a different background depending on the current data. For Day / Date/ Time and for Shower Thoughts the appropriate background screen is initially loaded and remains the same while that app’s data is displayed.
For each application, the program checks to see if it’s time to get fresh data from the internet (which occurs the first time the app runs and on a fixed schedule after that. If it does, it updates the old raw data from the internet. If not, the old raw data is kept. Then the program calls an application-specific python module t that extracts the relevant data from the JSON, formats it, and returns a text_group object for display. text_group is part of the displayio library for CircuitPython. I encourage interested readers to read the linked guide to the displayio library, as it took me some time to figure out how all the pieces fit together.
The display is then updated by appending the text group to splash attribute of the previously created Pyportal instance. splash is a displayio Group that is automatically displayed on the screen. After a delay to allow the update to remain on the screen for the specified number of seconds the Pyportal splash.pop() method is called to remove the text_group that had been added. If this were not done, Pyportal.splash would just keep getting bigger and bigger as each app runs over and over through the endless main loop.
I could probably refactor the main loop to make some things more generic and then move them into a common function call, rather than having so much separate for each application.
Day / Date / Time (day_graphics module)
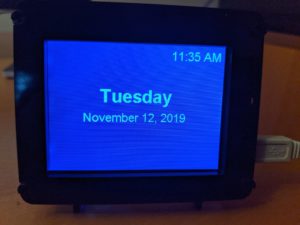
Day, date, and time display on the PyPortal
The PyPortal does not have an RTC, so while it has an internal clock function, it tends
to drift. However Adafruit provides their own time service to call and update the local time. This function is called once per hour to update the local time.
The day_graphics module parses out the date and time information from time.localtime() to extract the day of the week, day of the month, the month, and the year. It puts this in the desired string formatting and specifies the font and location on the screen for each displayed element.
Weather (openweather_graphics module)
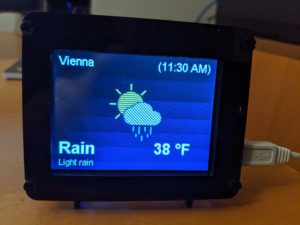
Current Weather Displayed on the PyPortal
For the weather, I chose to use openweathermap.org as the source for weather data and base my code on Adafruit’s PyPortal Weather Station example. That site has the local weather for my location and also has nice background icons for each weather type and whether it is daytime or nightime. There are several ways to specify the location you want the weather for, and various types of information available. This is all explained on their website. The example cited above used cityname and country, but that is ambiguous for my location, so I used their ID code for my location, which is unique.
The processing is very similar to the day/date/time app, although there is some additional work to convert temperature, which the API returns in degrees Kelvin, to Fahrenheit.
The icons are not downloaded using the API, but rather are stored on the PyPortal. The API returns the id number of the icon to be displayed. For this application, two items are returned from the function call: the text_group and the file name for the background image.
Shower Thoughts (st_graphics module)
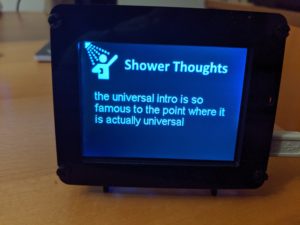
A “shower thought” displayed on the PyPortal
Shower Thoughts is a subreddit for “sharing those miniature epiphanies you have that highlight the oddities within the familiar.” Two recent examples are Taking notes in history class is rewriting history and You’d think the generation that grew up playing Oregon Trail would have more respect for some of these diseases. There is a JSON API to get these posts and I decided that it would be fun to have these cycle through.
The concept for this app is similar to the others, and in fact, only one field (the title) needs to be extracted from the JSON field (one of the rules of that subreddit is that the entire thought must fit in the title). However, the thoughts can still be rather long. If I used the small sized font, they generally appear rather small, but if I use the medium ones I have to truncate the thought n the middle. So the program checks the length, and uses the medium sized font if the message is short enough and otherwise uses the small sized font.
S&P 500 (market_graphics module)
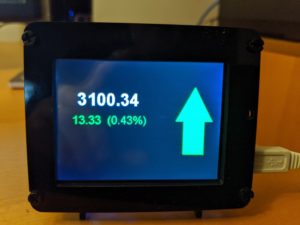
The S&P 500 value displayed on the PyPortal
The final application that this cycles through is getting the current value of the S&P 500 and comparing it to the previous day’s close. The data is obtained using a free API provided by Alpha Vantage.
Again, the processing is very similar. The customized features for this app is that the color of the amount and percent change is set as either green or red, depending on whether or not the index is up or down, and the background image is similarly selected to have either an upwards green arrow or a downwards red arrow.
Other Notes
The Pyportal is designed so that when something is written to it from a PC it does a soft reboot and starts running the main program. This is to make it really easy to do updates. The problem some folks have had, including myself, on a Windows 10 machine, is that it constantly does this soft reboot when plugged into either of my PCs. This doesn’t happen when it’s just plugged into a power source, then it runs fine. Apparently something keeps trying to write to it. As a work around, one can go into the REPL and type:
import supervisor
supervisor.disable_autoreload()
This turns off the auto-reload and soft reboot feature. Once that is done, one needs to stop a running program (type CTRL-C in the serial window) and then reload and restart by typing CTRL-D in the serial window. If anyone has a permanent fix for this problem, I’d love to hear it.
Sometimes the ESP32 board seems to have glitches, and an error condition is created and valid data is not returned. The try / except code in the main program just skips out of the application where that occurs and tries the next one. So far, this has caught and provided a work-around for all but one error, which popped up once after the application had been running for several days.
Summary
The PyPortal is a great little device that is capable of doing a lot (this example didn’t make use of the touchscreen features, built-in sensors, or i/o lines). Hopefully this example will be useful to others, especially if you want to have the PyPortal perform multiple functions, rather than only serving a single purpose at a time. Again, the code is available on gitHub.


