Sentiment Analysis and Web Charts with Python

I’m mostly retired, but still consult a bit in my field: Intelligent Transportation Systems (the use of advanced sensors, communications and information processing systems to improve ground transportation). The field includes connected and automated vehicles. And out of intellectual curiosity, I’ve also been learning about sentiment analysis. So I decided to combine these interests by tracking the change in sentiment over time, about automated vehicles, using tweets as the source material. And while I was at it, I figured I’d do the same thing for electric vehicles, and publicly display the results on two web pages.

One of the common, basic approaches to sentiment analysis is to determine whether the general tone of a sample of text is positive, negative, or neutral. That is the approach that I’ve taken. To determine this, one can use a rules-based approach, where certain words and word combinations are assigned tones and intensity (e.g., “hate” is very negative, “cool” is positive, “not cool” is negative). The scores for each sentiment word are combined to get an overall sentiment for the text sample. The other approach is to use machine learning algorithms to determine the sentiment. This approach can be more flexible, but requires a lot of training data, and the training data must be tagged by humans. In addition, multiple humans should review each sample, as studies have shown that humans can disagree with one another 20% of the time when assigning sentiment to a text sample.

I decided to use tweets posted on Twitter as the source material, since there are a large number of new entries every day and Twitter provides a free API that allows one to sample thousands of tweets per day, filtered by keywords and other parameters.

Once each tweet is assigned a sentiment value, I look at several metrics based on the total numbers of positive, negative, and neutral tweets. In addition, I extract and save the 100 most common 1 word and 2-word combinations found in the set of tweets for the day. The results are then used to generate several metrics, plots, and displays for the web pages.

The overall system for data collection, analysis, and display is shown…
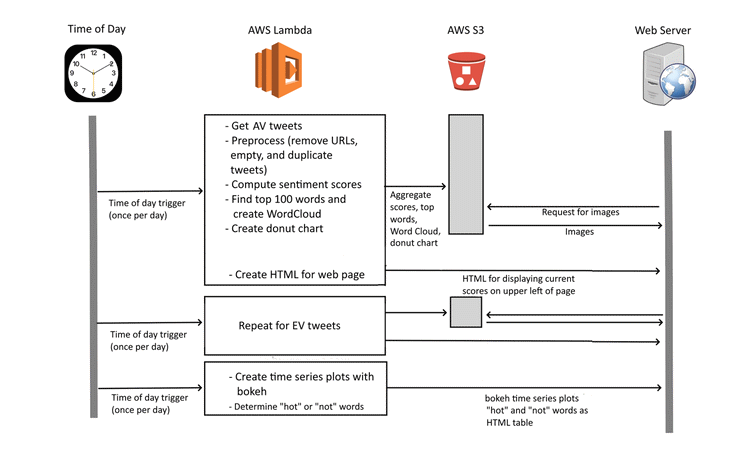
Swim diagram for this project analyzing the sentiment of tweets about AVs and EVs and publishing the results on a web page

Getting and Filtering Tweets

The first step is to get the relevant tweets and clean and filter them. Two almost identical programs are used, one for AV tweets and one for EV tweets. The reason these are not combined into a single program is that this would exceed the 15 minute access limit of Twitter’s API. Instead, each is run once, about an hour apart, during the middle of the night eastern standard time.

Twitter’s free “Essentials” access level lets one search through a sample of tweets that were posted in the last 7 days. In order to access the twitter API, one must first register. Then, I used tweepy, a free python library for accessing the Twitter API. The search query API provides for a large number of query parameters. For this project, I searched for tweets containing any of a list of key words and that were not retweets, replies, or quote tweets (i.e., only original tweets are included).

The search terms were selected to try to broadly collect relevant tweets, but to avoid accidentally capturing a significant number of irrelevant ones. For example, the AV search terms include “self driving,” “automated vehicles,” and “automated shuttles” but does not include “Tesla,” as many tweets with the word Tesla are about the stock price or other aspects of the company, not about autonomous vehicles.

The next steps filtered out empty tweets and remove URLs from the tweet contents. During development, manual inspection revealed a large number of identical or nearly identical tweets, mostly originating from bots that pick up and tweet news stories. Therefore a filter was set up to keep only one sample from these duplicates and near-duplicates. To remove exact duplicates I simply used the drop_duplicates method in pandas. Removing near duplicates proved more problematic. The basic approach is to assess the similarity between pairs of tweets, and if they are sufficiently similar, remove one of them. Unfortunately this involves comparing every tweet with every other tweet, and there are thousands of tweets. I found that efficiently iterating through the tweets required the use of pandas’ itertuples method. This was at least an order of magnitude faster than using iterrows or items methods. Even so, the first similarly library I tried to use, SequenceMatcher, took over 10 minutes to perform all the comparisons! In the end, I used the Levenshtein.normalized_similarity method from the RapidFuzz library. This brought the runtime down to seconds.

Sentiment Analysis

The filtered and cleaned up tweets were now each analyzed to determine the sentiment of the tweets. I experimented with a number of approaches and settled on using VADER, an open-sourced, rule-based tool for sentiment analysis, written in Python. VADER was specifically developed to analyze short social media posts, such as tweets. In addition, it runs very quickly, which is useful as I analyze thousands of tweets at a time on each of the two subjects.

I made two very minor changes to the VADER code. First, as reported in the “issues” on GitHub, some words are listed more than once in it’s dictionary, with differing sentiment values. For these, I used my best judgement on which to keep and discarded the duplicates. In addition, VADER lets the user add their own words to its dictionary of sentiments. Based on manual review of a large number of tweets, some additional words tailored to the subject matter were added and assigned sentiments:

  • “advances”: 1.2
  • “woot”: 1.8
  • “dystopia”: -2.5
  • “dystopian”: -2.5
  • “against”: -0.9
  • “disaster”: -2.5

Sentiment Metrics

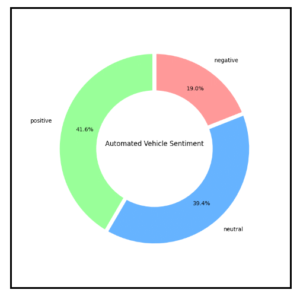
Donut chart showing percentages of positive, negative, and neutral tweets
Donut Chart showing the current day’s sentiments by percentage.

Once the sentiment of each tweet is determined, the results are aggregated. The total numbers of negative, positive, and neutral counts are calculated and stored in an AWS S3 storage bucket. Using matplotlib’s pyplot, a donut graph is created showing the percentages for each type of sentiment, and the graph is also stored in an S3 bucket for display on the web pages.

Two indices are also calculated: the ratio of the number of positive to negative tweets, ignoring neutral tweets, and the index, which is the average value, with each negative tweets counting as -1, neutral tweets as 0, and positive tweets as +1. These scores are put into an HTML fragment and transferred to the web server for incorporation into the two sentiment indices web pages.

Word Cloud

Word Cloud showing the 100 most common 1 and 2 word combinations

In addition to calculating the sentiment indices, the 100 most common single and two-word combinations are determined for the current days tweets. A word cloud image is also generated. Both of these are done using the WordCloud library. Both the word list and the Word Cloud are written out to one of the S3 buckets.

Time Series Charts with Bokeh

After both of the sentiment analysis programs are run each day, a single additional program is run. This program has two functions, each of which operate separately on the AV and EV data. First, it produces two time series plots of the sentiment indices, using the data stored in one of the S3 buckets. Second, it uses the most common words stored in S3 bucket and compares them with the list that was stored in the bucket 7 days ago. Words that appear in the most common 100 for the current day, but not the day a week ago are determined (“hot” words), as well as those that were on the list 7 days ago, but not today (“not” words). A subset of the list is then formatted into an HTML table for display on the web pages.

Bokeh is used to generate the two time series plots. I used bokeh rather than matplotlib because I wanted some interactivity on the web page, and Bokeh is a Python library for creating interactive visualizations for web browsers. The actual web scripts that Bokeh generates are in javascript.

This was my first time using Bokeh. It wasn’t hard to figure out how to generate the basic time series plots that I wanted, or to add the “hover” tool to allow one to see the value of particular data points. However, I had some trouble figuring out how to generate the results for use on a web page and then incorporating them in the page. Bokeh plots can require a server, for complex interactivity involving changing data or plots, or can be embedded as standalone plots. For this application, I used it in standalone mode. There are four modes that can be used for this, and as a beginner, I freely confess I don’t understand them well.

The file_html method returns a complete HTML document that embeds the Bokeh documents. That wouldn’t be appropriate for this application, as the Bokeh plots are embedded within other web pages. The json_item method “returns a JSON block that can be used to embed standalone Bokeh content.” I played around with this a bit, but I don’t really understand it. The components method returns “Return HTML components to embed a Bokeh plot. The data for the plot is stored directly in the returned HTML.” I didn’t explore this one at all. Finally, the autoload_static method returns “JavaScript code and a script tag that can be used to embed Bokeh Plots. The data for the plot is stored directly in the returned JavaScript code.” This is what I used. The method returns a tuple consisting of JavaScript code to be saved and a <script> tag to load it. The <script> tab is placed at the appropriate location in your HTML.

There are several ways to embed the plots in your HTML. I used a server side include, and the section of code looks like this:

            <div class="bokeh">
            <!--#include file="AV_ratio.tag" -->
            </div>

You can see the two plots in the left column of the AV Sentiment Index web page. Static screenshots are shown below:
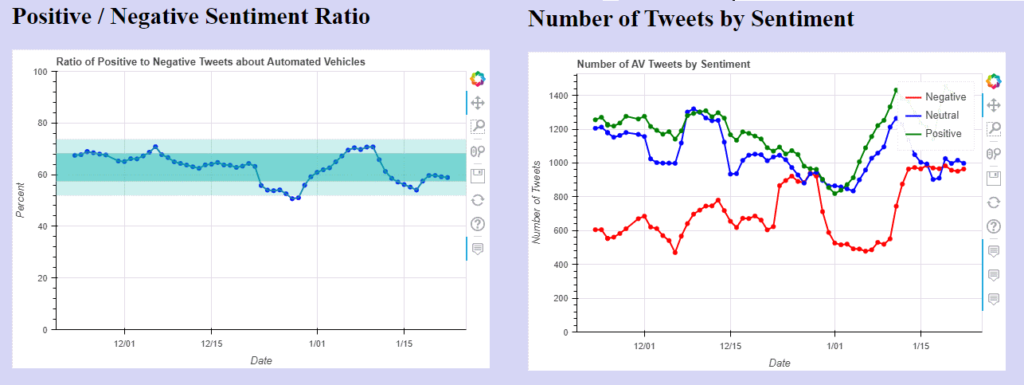
Time series plots generated using Bokeh

Initial Observations

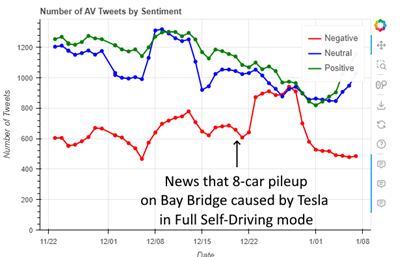
Figure from Observing the Effect of a Crash on Twitter Sentiment: Early Results from Time Series Data, showing the correlation between news of a crash and a sharp rise in negative tweets regarding AVs

Shortly after I began to capture data, the sentiment regarding automated vehicles dipped sharply for about a week, with the number of negative tweets rising sharply and the positive to negative ratio dropping 2 standard deviations below the mean. In checking what was happening, news had just broken of a major multi-vehicle crash involving a vehicle in self-driving mode. This news was clearly reflected in the negative tweets, with “hot” words that frequently occurred, but had been missing the previous week such as “Bay Bridge,” “Tesla full,” “eight car,” “eight vehicle,” and “vehicle crash.”

Update, 4/23/2024: I’ve now completed this project by publishing two reports analyzing the sentiment data. For those interested, the reports are Seasonality and Variance of Twitter Sentiment Regarding Electric and Automated Vehicles, which looks at the seasonality, variance, long term trends, and skew in the sentiment data, and The Best of Days, the Worst of Days: Twitter Sentiment Regarding Automated Vehicles, which looks at a dozen outlier days, the causes of the extreme sentiment on those days, and the long term impact of these events.

Dynamic Toll Data: My First “Real” Alexa Skill

Summary

This project uses a combination of screen-scraping and an API to obtain current travel speeds and the current variable toll costs for Interstate 66 inside the beltway in northern Virginia, and provides the information to users via Amazon’s Alexa voice service. To try it out, first enable it (either just say “Enable sixty six tolls” or visit Sixty Six Tolls in the Amazon skills store). From then on, just say “Open sixty six tolls.”

Resources

The project uses Alexa’s voice service. The code is written in Python 3, using the Alexa Skills Kit SDK for Python. The code runs on AWS’ lambda service. It also makes (minimal) use of DynamoDB to store user-specific information. Travel times are scraped from the Virginia DOT’s (VDOT’s) 511 Virginia Traffic Information website. The real-time toll prices are obtained via an API to VDOT’s SmarterRoads data portal. Web scraping and XML parsing was done using Python’s Beautiful Soup library.

The python code as well as the interaction model (a JSON file) are available at https://github.com/ViennaMike/I-66-Tolls

Background

I was looking for a project that would use one of the data sets on the SmarterRoads portal, and I decided that it would be useful to be able to check the dynamic tolls on Interstate 66 inside the Beltway in Northern Virginia. Inbound traffic is tolled between 5:30 and 9:30 am, while outbound traffic is tolled between 3:00 and 7:00 pm.

The tolls are dynamically adjusted to maintain high speeds. While the toll may change between checking the cost at home and the time a driver reaches their entrance, it’s still useful to have an idea of the highly variable toll, especially since tolls for the entire 10 mile length have sometimes spiked at over $40. 

I had previously written a simple quiz skill using Amazon’s template, but this was my first custom skill.

Description

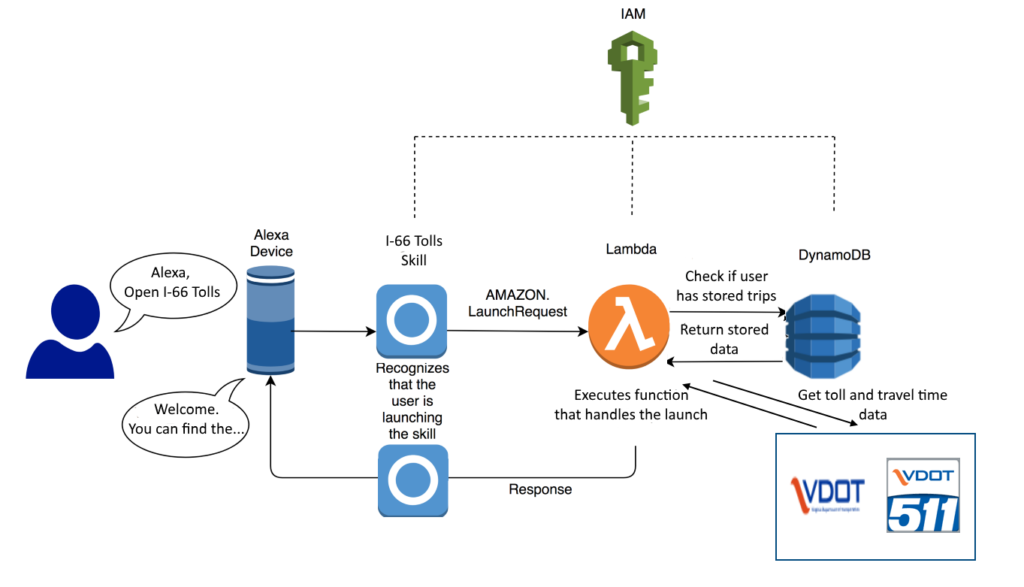
The overall architecture for the Alexa skill is shown below:

High Level Architecture

When a user interacts with the skill, the input is processed according to the interaction model that the developer defines in the Alexa Skill builder. This is captured in a JSON file. The skill builder is also where you tell the skill where to find the execution code for handling requests and ready a skill for certification and distribution.

In the case of 66 Tolls, there are eight custom intents, along with the Alexa built-in intents such as HelpIntent, FallbackIntent, StopIntent, etc. The custom intents are:

  • get_speeds for getting speeds and travel times for the two roughly parallel travel options (I-66 and US-50)
  • get_toll_hours to get static information on the hours that tolls are in effect
  • get_details to get additional static information about how the dynamic tolling system works
  • list_interchanges to get a list of inbound and outbound entrances and exits
  • get_toll to get the current toll price for a specified direction from a given entrance to exit
  • save_trip to save the user’s most frequent entrance and exit in each direction
  • get_favs to report back to the user what trips he has previously saved.
  • get_specific_help to provide help on particular types of requests (get toll, get speeds, and save trips).

When the skill is opened by a user who has previously saved a trip, the skill immediately returns the appropriate current inbound toll if it’s in the morning, or outbound toll if it’s in the evening or afternoon.

The Alexa Skills Kit SDK contains built-in functions to simplify interacting with Amazon’s DynamoDB NoSQL database. This skill uses a simple DynamoDB table to store the user_id (the key), most frequent inbound entrance and exit, and most frequent outbound entrance and exit.

By far the easiest part of the project was the code to get the travel times and tolls from the two VDOT sources. There is an API for the tolling data, and I had to do some simple web-scraping to get the travel time data. This code can be found in the get_travel_times() and get_tolls() functions in the code.

Developing the voice interaction model took multiple iterations, and I found that as time went on, I was able to improve the dialog model while reducing the number of intents and number of slot types associated with each intent. However, even then, I found that the first released version of my skill didn’t work for users the way I had intended. For the most part is worked well technically (there was one bad bug), but users other than myself said things differently than I had thought they would, and asked for help differently. It definitely pays off to not just spend time thinking of how users will interact with your skill (as I did at first), but in having others test out your skill as well, and getting there feedback.

Because this was new to me, it took considerable time, as well as trial and error, to figure out how to write the handler code, and especially how to handle the session and persistent attributes and the interaction with DynamoDB. I used a large number of resources, with the best being the Skill SDK documentation, the Color Picker sample app, and A Beginner’s Guide to the New AWS Python SDK for Alexa, by Ralu Bolovan. As described in the documentation, the python SDK supports two coding models, one based on functions with decorators, and the other based on classes. I chose to use classes, but the Color Picker example uses decorated functions.

Some of the hassles I had came from two factors: 1) the interface to Alexa skills has changed over time. It’s been improving, but this also meant that some of the samples and tutorials on the web are out of date. 2) While there is thorough documentation, a lot of tutorials and examples focus on simple demonstrations. For this reason, it may have been better for to step back and read more of the SDK rather than always jumping in. For example, I needed to have my code do something every time an intent was called, regardless of what the intent was. It turns out this is handled by Request Interceptors and Response Interceptors, which most of the simple samples leave out. This, along with the thorough walk-through on using DynamoDB, is why I found the Beginner’s Guide to the New AWS Python SDK for Alexa to be so helpful.

I originally wanted the invocation for the skill to be “i sixty six tolls,”, but I found that Alexa had trouble recognizing this as the invocation. For this reason, I had to make the invocation “sixty six tolls” rather than “i. sixty six tolls.”

I also found that if you use Alexa’s built in “confirm” capability, then when your code is called for the first time, the handler_input.request_envelope.session.new is set to False, apparently because the built-in confirmation request kicked off the session. That’s something to be careful of. For this and other reasons, I ended up checking whether or not I had previously initialized the session attributes, rather than whether or not the session was new.

The last technical bug I fixed was that I hadn’t thought about what “local time” was to the server. I have been naively thinking that since I was using AWS’s Northern Virginia server, the local time would be the US eastern time zone, but all Lambda servers use GMT as their local time, which makes a lot more sense. So I used the pytz library to convert to local time.

For the voice interface, I found I had to expand the list of synonyms for slot values (such as the names used for exits), add more specific help queries, besides the comprehensive, and therefore long, “help” intent, and make use of the interface’s built-in capabilities for checking user-provided slot values, which I hadn’t read about in the simple tutorials.

I hope that this example will prove helpful for others who want to write their own custom Alexa skills.

Using Geek Power for Good: Better Living Through Code Edition

bottle of Buffalo Trace bourbon

Buffalo Trace bourbon

Bourbon has become a hot commodity, and as it takes years to make, the supply can’t quickly ramp up to match demand. Buffalo Trace is one of many brands that have become quite popular, making it hard to find. The clerk at a local Virginia ABC store told my wife that they get a small shipment in and it “flows out like a river”, and is gone in a day. My wife found that you could check inventory of local stores online, and asked me to write a script to check it. Starting tomorrow morning, the “Buffalo Hunter” script will run once a day, check the inventory at our two closest stores, and send her a text if there are any bottles in stock.

Version 1 was a fun 1-day project. I had to learn some new tricks, as the page uses client-side javascript and I hadn’t used Twilio to send texts before, but I got it all working well. Some time later I decided to port it to the cloud, using the AWS Lamda service, which had a short but steep learning curve.

The website uses javascript to generate a dynamic page, so I couldn’t simply use something like Beautiful Soup to parse the html. So I used Selenium, using a Chrome headless browser on my local version, switching over to phantomjs on AWS. I switched to phantomjs because you need to have executables compiled to run under AWS, and I found a precompiled version of phantomjs on the web, and didn’t find the same for Chrome.

There was one other “gotcha” I ran into. I use Windows. While I had found a correctly compiled phantomjs executable, when I zipped it along with the other files to upload, it lost its permissions settings. I could have booted up in Linux, instead I installed the Linux subsystem that’s available for Windows 10 and used bash to zip the files up. That ended up working fine. You also need to change the directory for the phantomjs log to the /tmp/ folder that AWS gives you write access to.

In version 1, I handed off the final processed web page to Beautiful Soup because I hadn’t used Selenium’s parsing before, and I’d used Beautiful Soup’s. You can easily hand off the processed resulting web page from Selenium to Beautiful Soup (see the commented out line that starts page2Soup in the code below). When I moved to Amazon, I also figured out how to do the page scraping in Selenium, so that I didn’t need Beautiful Soup any more. The concept’s simple, but I didn’t find a good reference for the find_element)by_css_selector in python, so it took a little trial and error. .If you’re interested, here’s the version of the code that runs on AWS:

Buffalo Hunter.py


import logging
import datetime
import time
# from bs4 import BeautifulSoup
from selenium import webdriver
from twilio.rest import Client

accountSID='SID Here'
authToken = 'token here'
stores = {'219': 'Old Courthouse' , '231': 'Maple Ave.'}

# options = webdriver.ChromeOptions()
# options.add_argument('headless')
# driver = webdriver.Chrome('c:/program files (x86)/chromedriver.exe')
driver = webdriver.PhantomJS(executable_path="/var/task/phantomjs", service_log_path='/tmp/ghostdriver.log')

def myhandler(event, context):
	try:
		results = ''
		success = 0
		for store in stores:
			driver.get('https://www.abc.virginia.gov/stores/'+store)
			make_my_store = driver.find_element_by_id('make-this-my-store')
			make_my_store.click()
			time.sleep(5)
			driver.get('https://www.abc.virginia.gov/products/bourbon/buffalo-trace-bourbon#/product?productSize=0')
			time.sleep(5)
			element = driver.find_element_by_css_selector('td[data-title="Inventory"]')
			# page2Soup = BeautifulSoup(driver.page_source, 'lxml')
			# element = page2Soup.find("td", {"data-title": "Inventory"})
			inventory_value = element.text
			if inventory_value <> '0': success = 1
			results= results+stores[store] +' has '+inventory_value+ ' bottles of Buffalo Trace. '
		driver.close()
		driver.quit()
	# Send results if inventory not 0 at both stores
		if success == 1:
			results = 'Success! ' + results
			twilioCli = Client(accountSID, authToken)
			myTwilioNumber = 'myPhoneNumberHere'
			destinationCellNumber = 'destinationCellNumberHere'
			message = twilioCli.messages.create(body=results,from_=myTwilioNumber, to=destinationCellNumber)
	except Exception as e:
		logging.error(str(datetime.datetime.now())+' Error at %s', 'division', exc_info=e)